The information contained on this page is currently being used for the 2021 CoMotion Miami Challenge Powered by I-STREET.
“I-STREET” is a real-world testbed located in Gainesville, Florida. The testbed is dedicated to advancing the state-of-the art in connected and automated vehicle implementation, and it is a joint effort between the Florida Department of Transportation, the University of Florida Transportation Institute (UFTI), the City of Gainesville, and industry partners. I-STREET addresses V2X implementation for vehicles, pedestrians, and bicycles; it utilizes machine learning and AI; and it uses a database platform to assess safety and mobility across the testbed. With the confluence of UF, Gainesville, and Interstate 75, I-STREET leverages a multimodal roadway network and emerging transportation technologies to advance safety, mobility, workforce, and innovation.
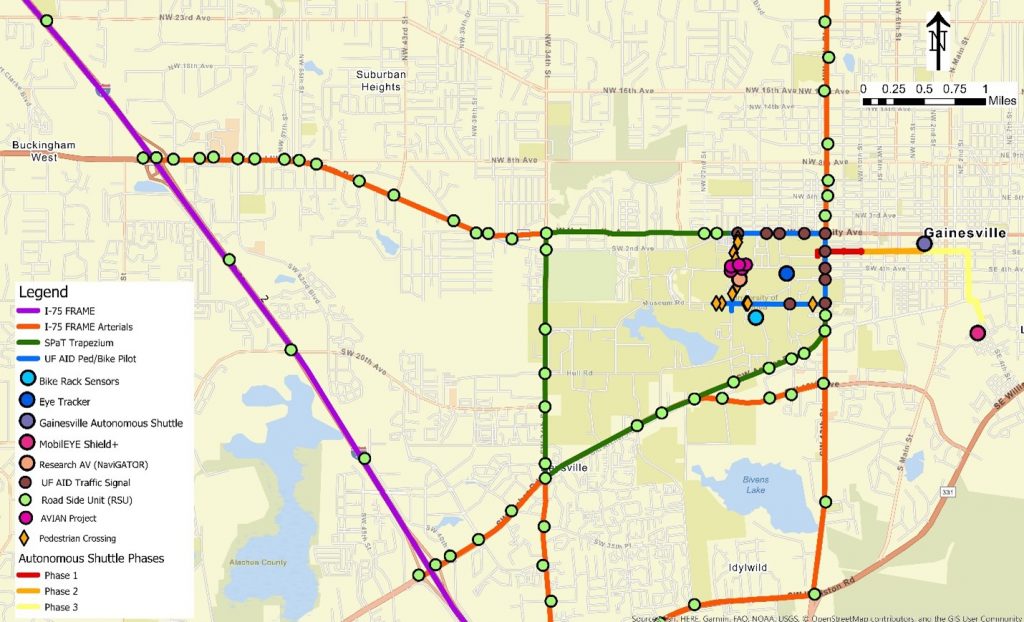
I-STREET Infrastructure
I-STREET testbed contains the following components:
- 129 Road Side Units (RSUs)
- 56 On Board Units (OBUs)
- 5 Autonomous Vehicles (AVs)
- Gainesville Autonomous Shuttles (4)
- Research AV – NaviGATOR (1)
- Custom Instrumentation from Research at UFTI
- DSRC Communication Equipment (Cohda Mk5 radios, Mobilemark Antennas)
- Smartmicro 2D and 3D Radars
- Econolite Autoscope Vision camera
- Real-time Intersection Optimizer (RIO) Software Program
- Other Equipment
- Mobileye Shield+ – Advanced Driver Assistance System (ADAS) on RTS Transit buses
- Bike Rack Sensors on RTS transit buses
- Eye Trackers
- Smartphone Applications
I-STREET Data
Signal Data
Format: [Data sets], (B) type, (C) bin rate/periodic refresh rate, (D) granularity (E) method of acquiring
- [ATSPM data]: (B) tabular, (C) bins are every 5 minutes, (D) contents every 0.1 seconds, (E) via API through spm.traffops.com, or directly from controller FTP/SCP protocol
- [DSRC SPaT data]: (B) tabular, (C and D) real-time, every 0.1 seconds, (E) via API through “Siemens” XFER protocol or directly from OBU that is enrolled in SCMS
- [Signal timing and Coordination data]— (B) Mostly static, unless we (or a consultant) retime an arterial segment. (C and D) only when changed (E) via Trafficware’s ATMS.now client
Traffic Count/Flow Data
- Detection Data (B) Tabular (C) bins every 24 hours; (D) every 15 minutes (E) via GridSmart Client; or Iteris Client This can be a per approach (i.e. like a turning movement count); or per detector channel (i.e. say per lane of a 3 lane approach)
- Arterial Segment Travel Time Data
- Trapezium has the Siemens/Acyclica (uses Bluetooth and Wifi temporal address matching)
- FRAME (several arterials – about 60+ intersections) has the TrafficCast/Bluetooth Data
- Waze for Cities (but not very granular) —our waze for Cities feed is now link within our “TrafOps” portal
- ADT/Average Daily Traffic or Tube counts — 90 count locations are obtained every other year, during the Spring and fall
Video Data (note City of Gainesville Traffic Operations does not record, they can share the stream to researchers)
- Fisheye camera from GridSmart Video Detection(via VLC or other open source RTSP client) about 35 locations
- Fixed camera from Iteris Video Detection (via VLC or other open source RTSP client) – about 50 locations
- Pan-Tilt-Zoom (PTZ) camera (CCTV Devices from Bosch) – (via VLC or other open source RTSP client) – about 200 locations.